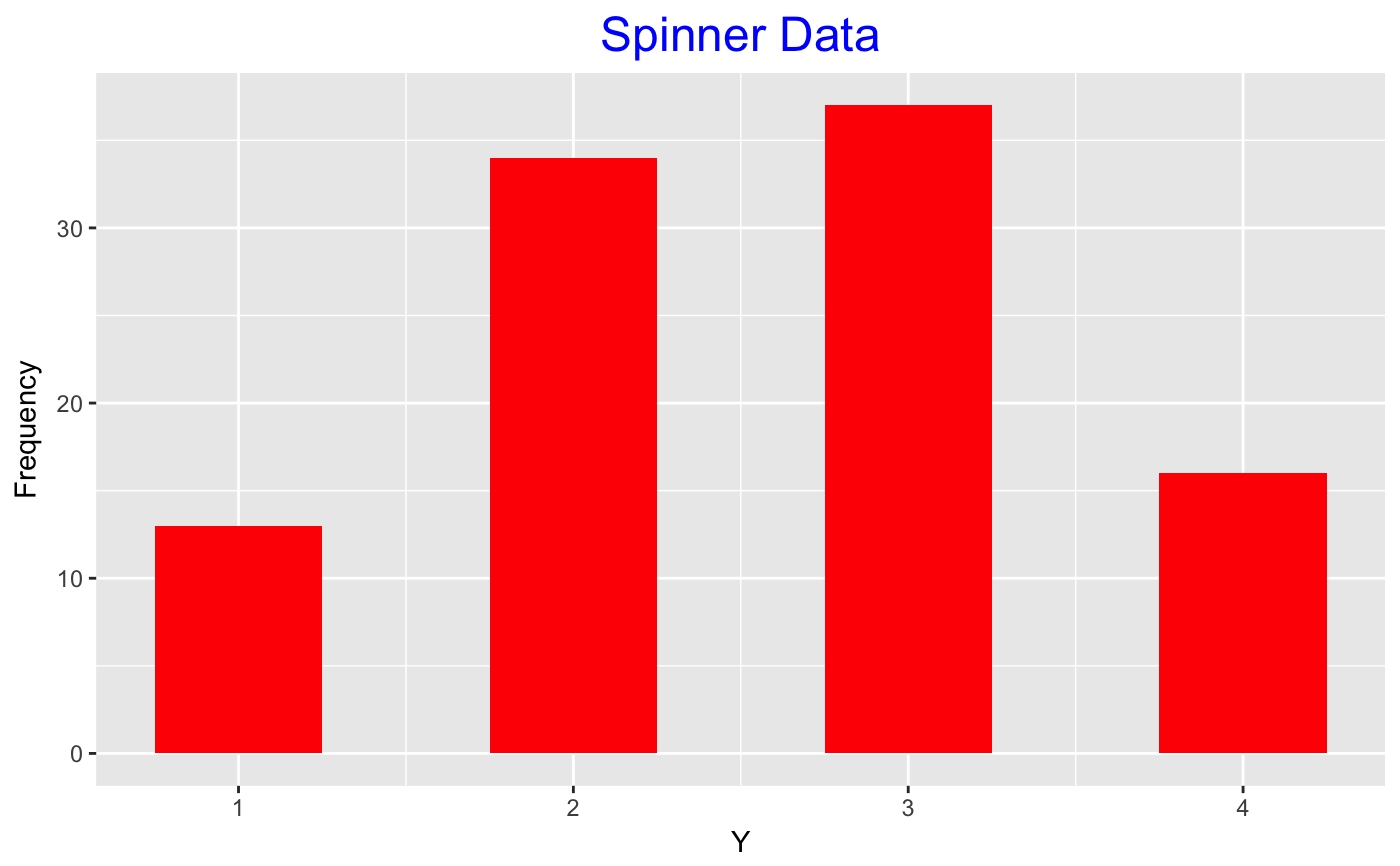
Bar plot of numeric or character data
bar_plot.RdConstructs frequency bar plot of a vector of numeric data or a vector of character data
bar_plot(y, ...)
Arguments
| y | vector of outcomes |
|---|---|
| ... | title of the graph |
Value
A frequency bar graph of the outcomes
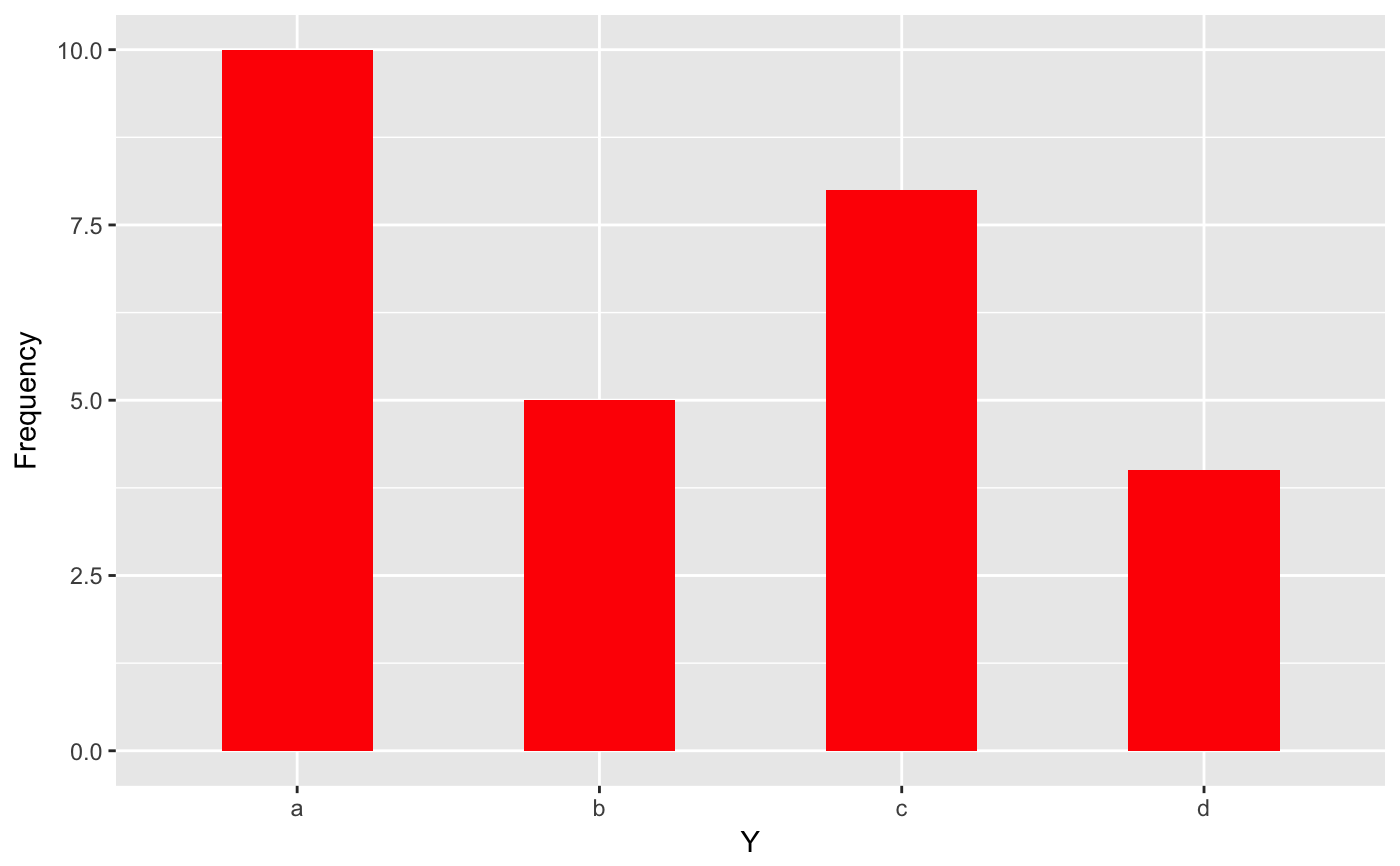
Examples
y <- c(rep("a", 10), rep("b", 5), rep("c", 8), rep("d", 4)) bar_plot(y)