Two_Proportions
two_proportions.RmdThe TeachBayes package has several functions to facilitate working with a discrete prior for two proportions.
library(TeachBayes)Uniform Prior
Start with a uniform prior on (p1, p2), where each proportion takes on values .05, .15, …, .95.
prior <- testing_prior(.05, .95, 10,
                       uniform=TRUE)
Construct a graph of this distribution.
draw_two_p(prior)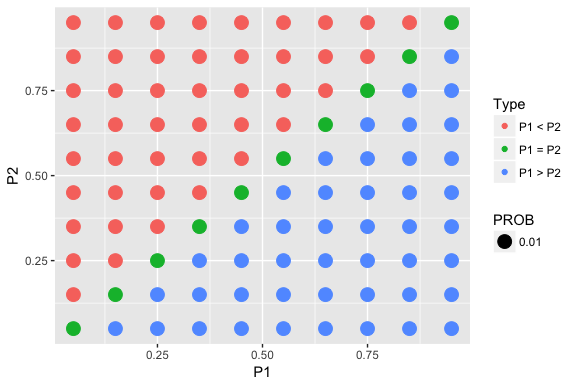
This finds the probability distribution of the difference in proportions p1 - p2, and plots the distribution.
(diff_dist <- two_p_summarize(prior))## # A tibble: 19 x 2
## diff21 Prob
## <dbl> <dbl>
## 1 -0.9 0.01
## 2 -0.8 0.02
## 3 -0.7 0.03
## 4 -0.6 0.04
## 5 -0.5 0.05
## 6 -0.4 0.06
## 7 -0.3 0.07
## 8 -0.2 0.08
## 9 -0.1 0.09
## 10 0 0.1
## 11 0.1 0.09
## 12 0.2 0.08
## 13 0.3 0.07
## 14 0.4 0.06
## 15 0.5 0.05
## 16 0.6 0.04
## 17 0.7 0.03
## 18 0.8 0.02
## 19 0.9 0.01prob_plot(diff_dist)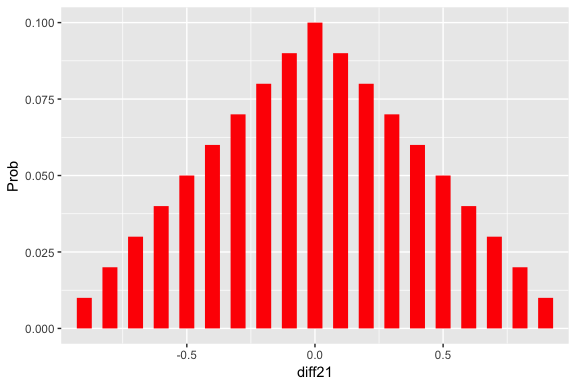
Collect some data from two binomial samples.
y1n1 <- c(10, 20)
y2n2 <- c(8, 24)
Update (find posterior):
post <- two_p_update(prior, y1n1, y2n2)Graph and summarize:
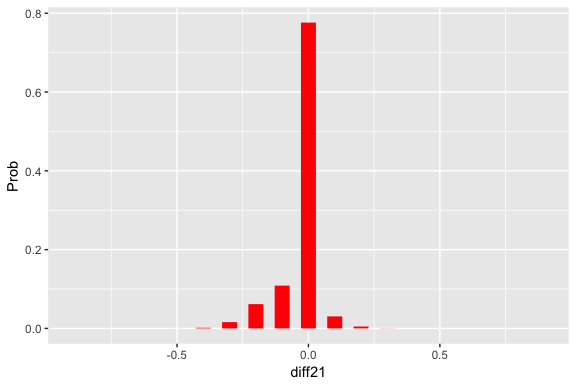
draw_two_p(post)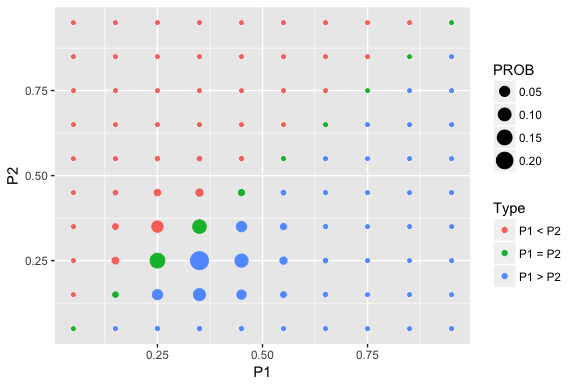
prob_plot(two_p_summarize(post))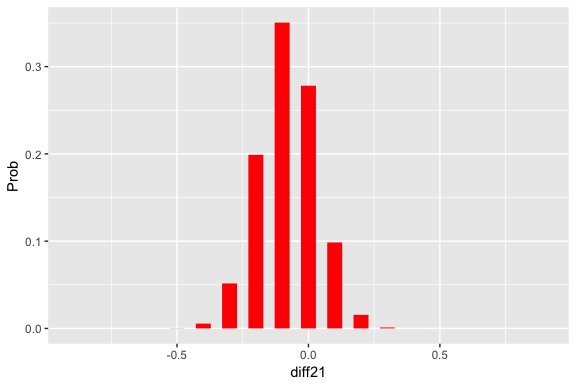
Testing Prior
prior <- testing_prior(.05, .95, 10, pequal=0.5)Construct a graph of this distribution and summarize.
draw_two_p(prior)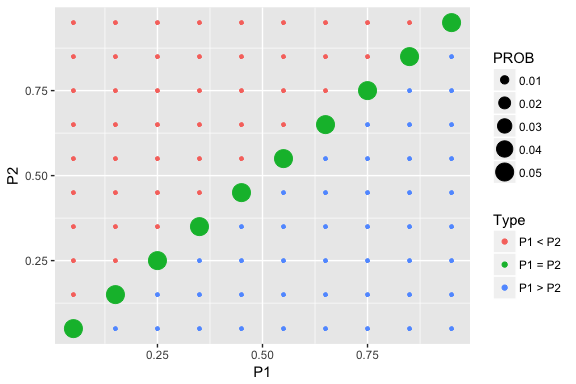
prob_plot(two_p_summarize(prior))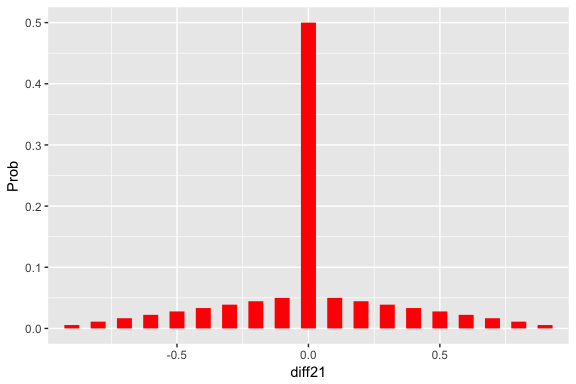
Collect some data from two binomial samples.
y1n1 <- c(10, 20)
y2n2 <- c(8, 24)
Update (find posterior):
post <- two_p_update(prior, y1n1, y2n2)Graph and summarize:
draw_two_p(post)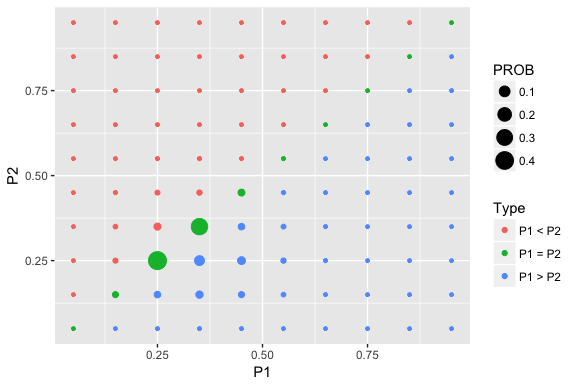
prob_plot(two_p_summarize(post))