Constructs a graph of a probability distribution
prob_plot.RdConstructs a graph of a discrete probability distribution
prob_plot(d)
Arguments
| d | data frame where the first two columns are the variable and associated probabilities |
|---|
Value
A ggplot2 object containing the plot display
Examples
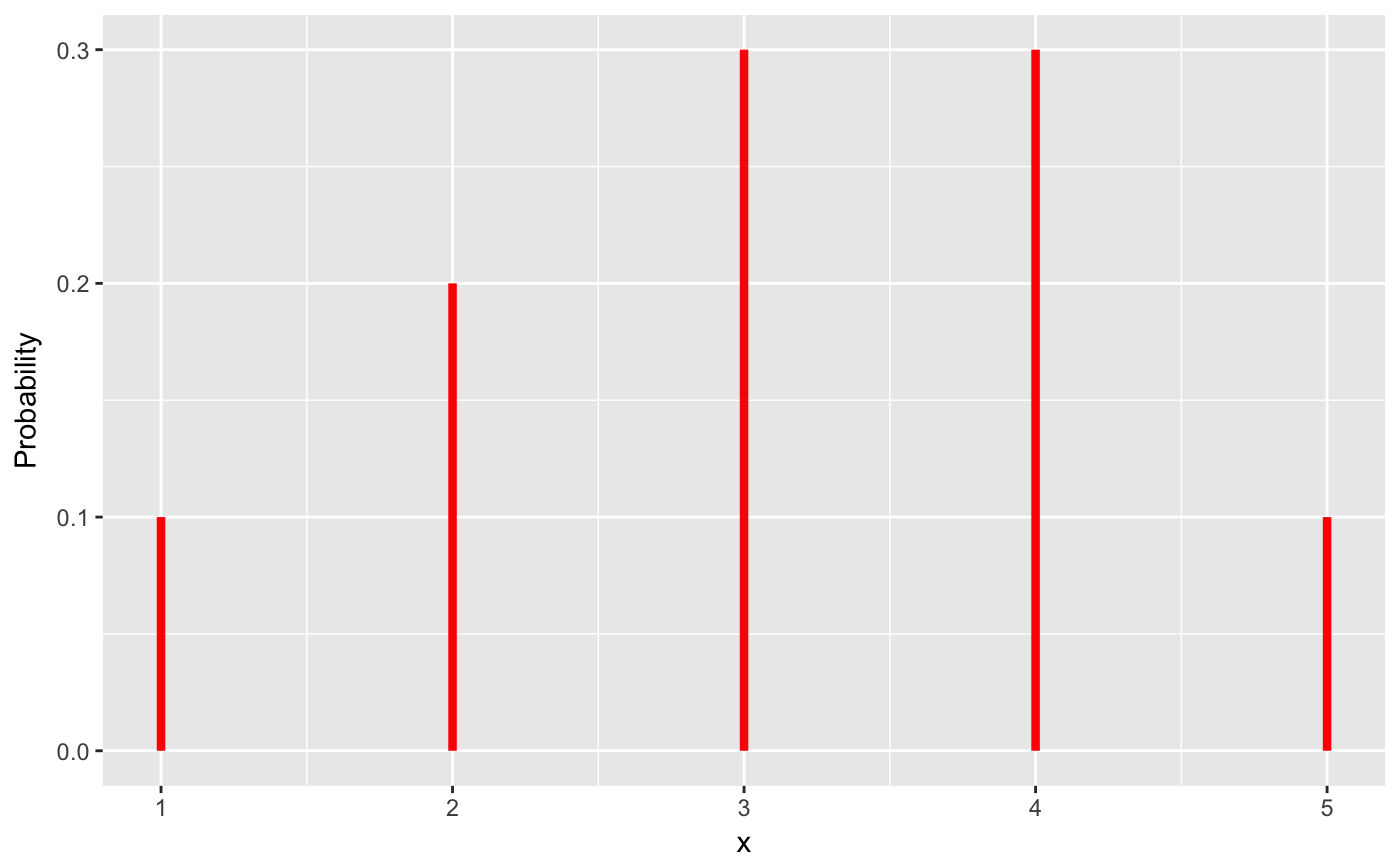
  probability_df <- data.frame(x=1:5,
         Probability=c(.1, .2, .3, .3, .1))
  prob_plot(probability_df)