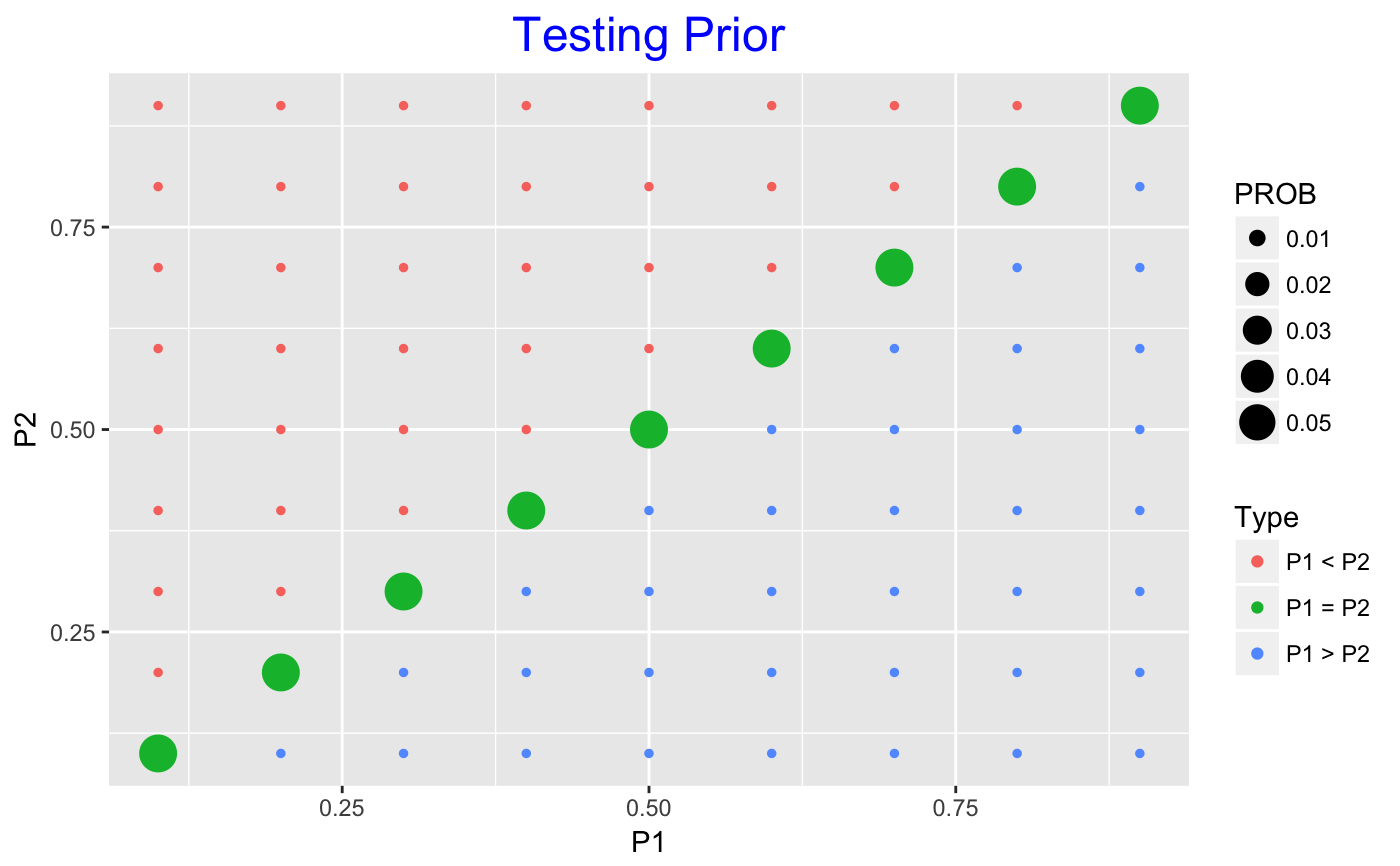
Plot of Distribution of Two Proportions
draw_two_p.RdConstructs a graph of the probability distribution of two proportions
draw_two_p(prob_matrix, ...)
Arguments
| prob_matrix | matrix of probabilities of two proportions with the rows and columns labeled by the values |
|---|---|
| ... | other arguments such as the title of the plot |
Value
graphical display of the joint probability distribution