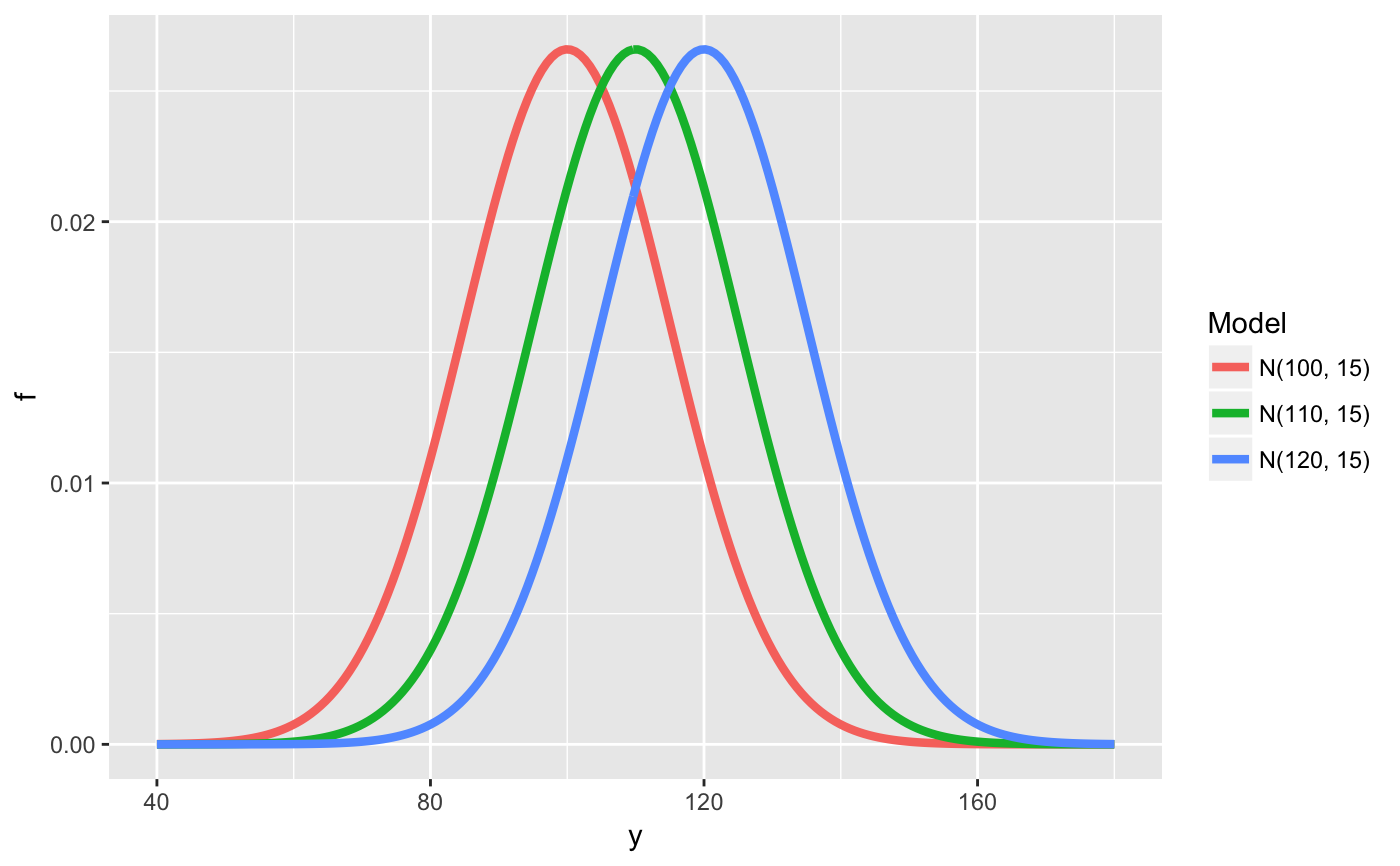
Graph of several normal curves
many_normal_plots.RdGraph of several normal curves
many_normal_plots(list_normal_par)
Arguments
| list_normal_par | list of vectors, where each vector is a mean and standard deviation for a normal distribution |
|---|
Value
Displays the normal curves on a single panel with labels
Examples
 normal_parameters <- list(c(100, 15),
     c(110, 15), c(120, 15))
 many_normal_plots(normal_parameters)