Displays Area Under a Normal Curve
normal_area.RdComputes and Displays Area Under a Normal Curve
normal_area(lo, hi, normal_pars)
Arguments
| lo | lower bound of interval |
|---|---|
| hi | upper bound of interval |
| normal_pars | vector of mean and standard deviation of the normal curve |
Value
Probability that normal random variable falls between two values
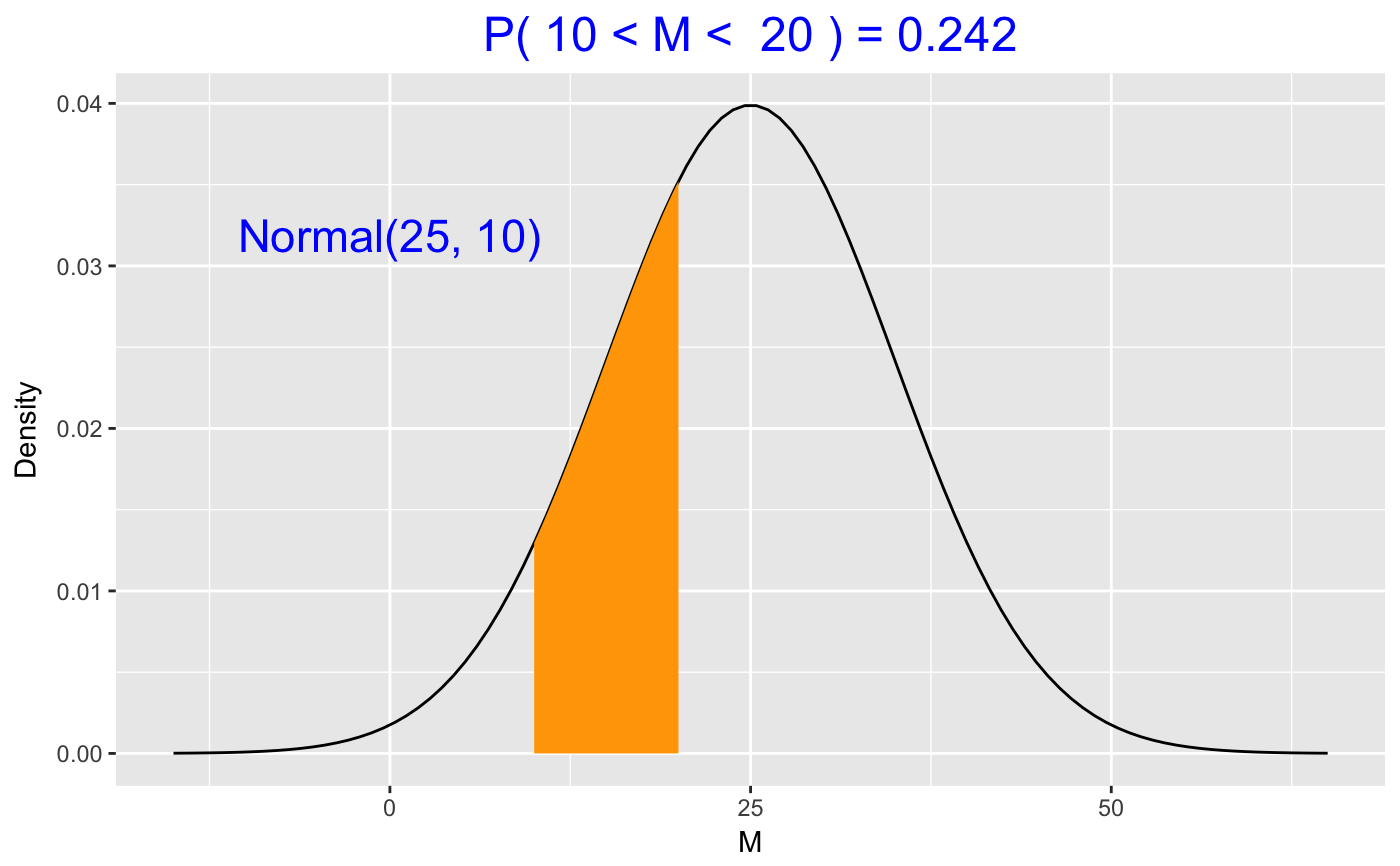
Examples
  lo <- 10
  hi <- 20
  parameters <- c(25, 10)
  normal_area(lo, hi, parameters)