Implements Bayes' rule for a spinner problem
spinner_bayes.RdComputes and plots the posterior distribution of spinners given a sequence of spins
spinner_bayes(list_regions,
                prior,
                data,
                plot=TRUE)
Arguments
| list_regions | list of vectors of integer areas for the spins 1, 2, ... |
|---|---|
| prior | a vector containing the prior probabilities for the spinners |
| data | a vector containing the spin values where 1, 2, 3, ... are the possible spins |
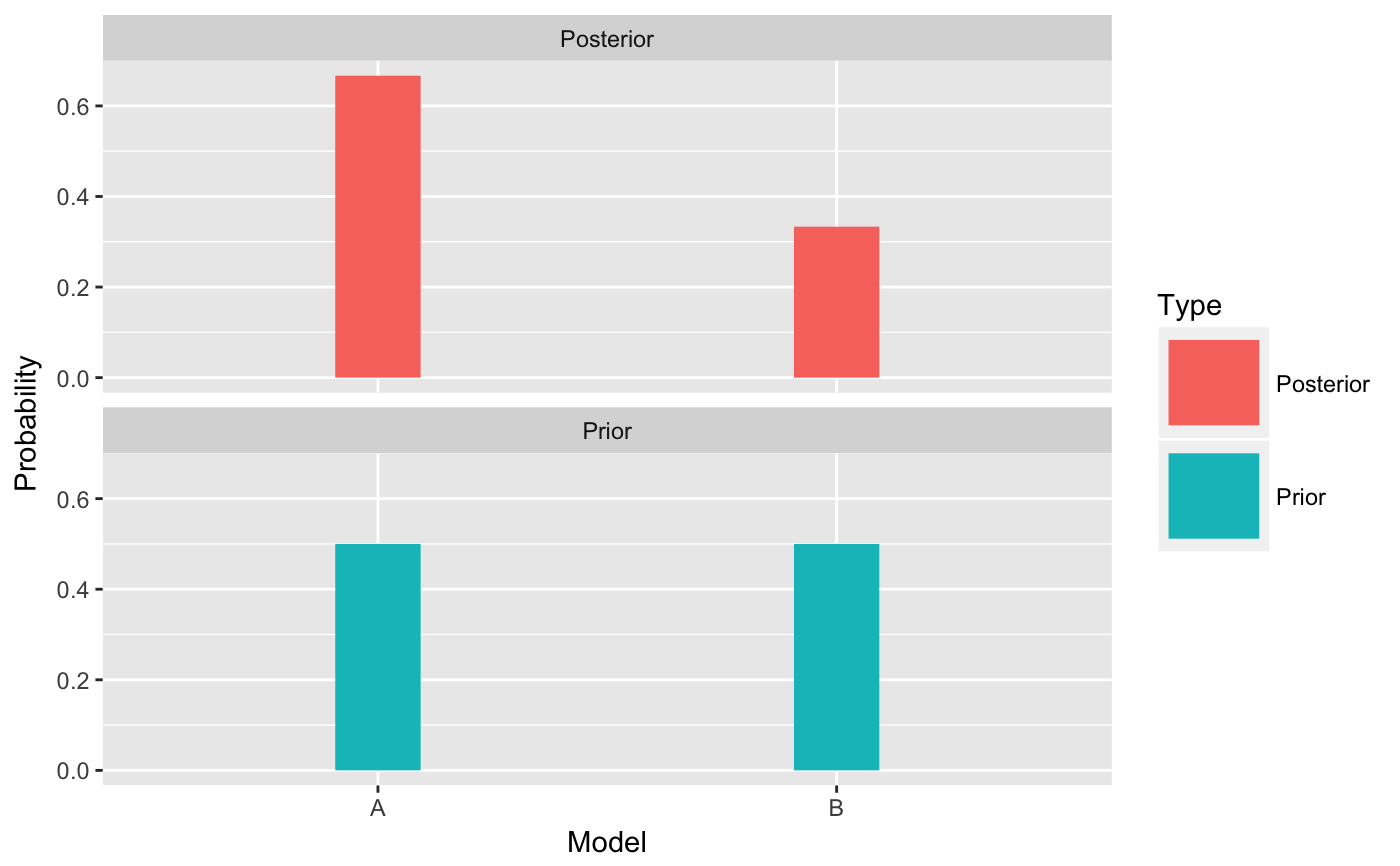
| plot | if plot=TRUE, a comparative graph of the prior and posterior probabilities is displayed |
Value
A data frame with variables Spinner, Prior, Likelihood, Product, and Posterior
Examples
  regions1 <- c(1, 1, 1)
  regions2 <- c(2, 1, 2, 1)
  data <- c(1, 1, 1, 2)
  spinner_bayes(list(regions1, regions2),
                prior=c(0.5, 0.5),
                data)#>   Spinner Prior Likelihood    Product Posterior
#> 1       A   0.5 0.01234568 0.00617284 0.6666667
#> 2       B   0.5 0.00617284 0.00308642 0.3333333