Constructs a spinner
spinner_plot.RdConstructs a spinner with different regions
spinner_plot(probs, ...)
Arguments
| probs | vector of probabilities for the spins 1, 2, ... |
|---|---|
| ... | optional vector of values and title |
Value
A ggplot2 object containing the spinner display
Examples
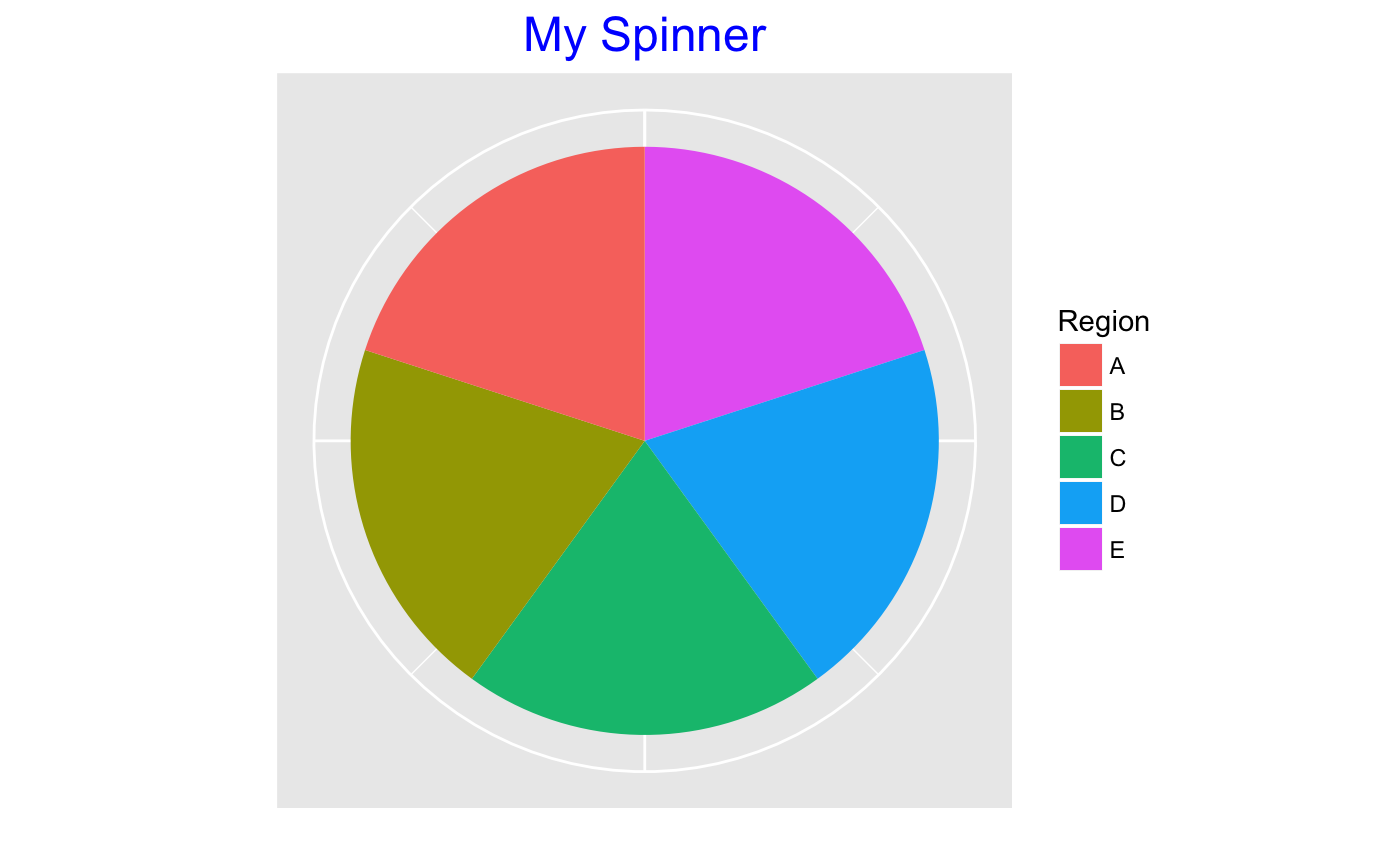
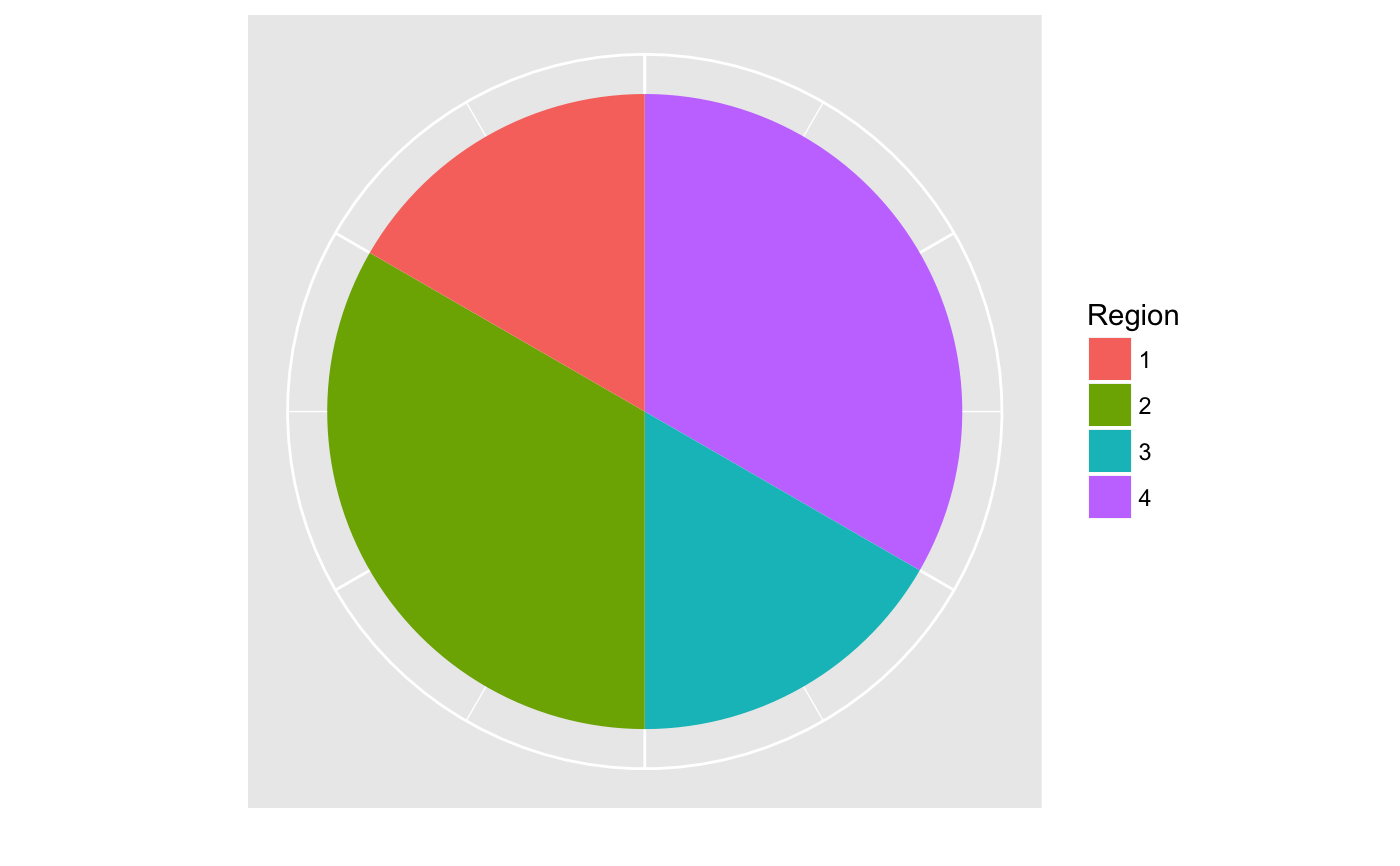
probs <- rep(.2, 5) spinner_plot(probs, values=c("A", "B", "C", "D", "E"), title="My Spinner")# probs does not need to be normalized spinner_plot(c(1, 2, 1, 2))