Graphs prior and posterior probabilities
prior_post_plot.RdGraphs prior and posterior probabilities from a discrete Bayesian model
prior_post_plot(d,...)
Arguments
| d | data frame where the first column are the model values, and columns named Prior and Posterior |
|---|---|
| ... | gives an alternative label for the x axis |
Value
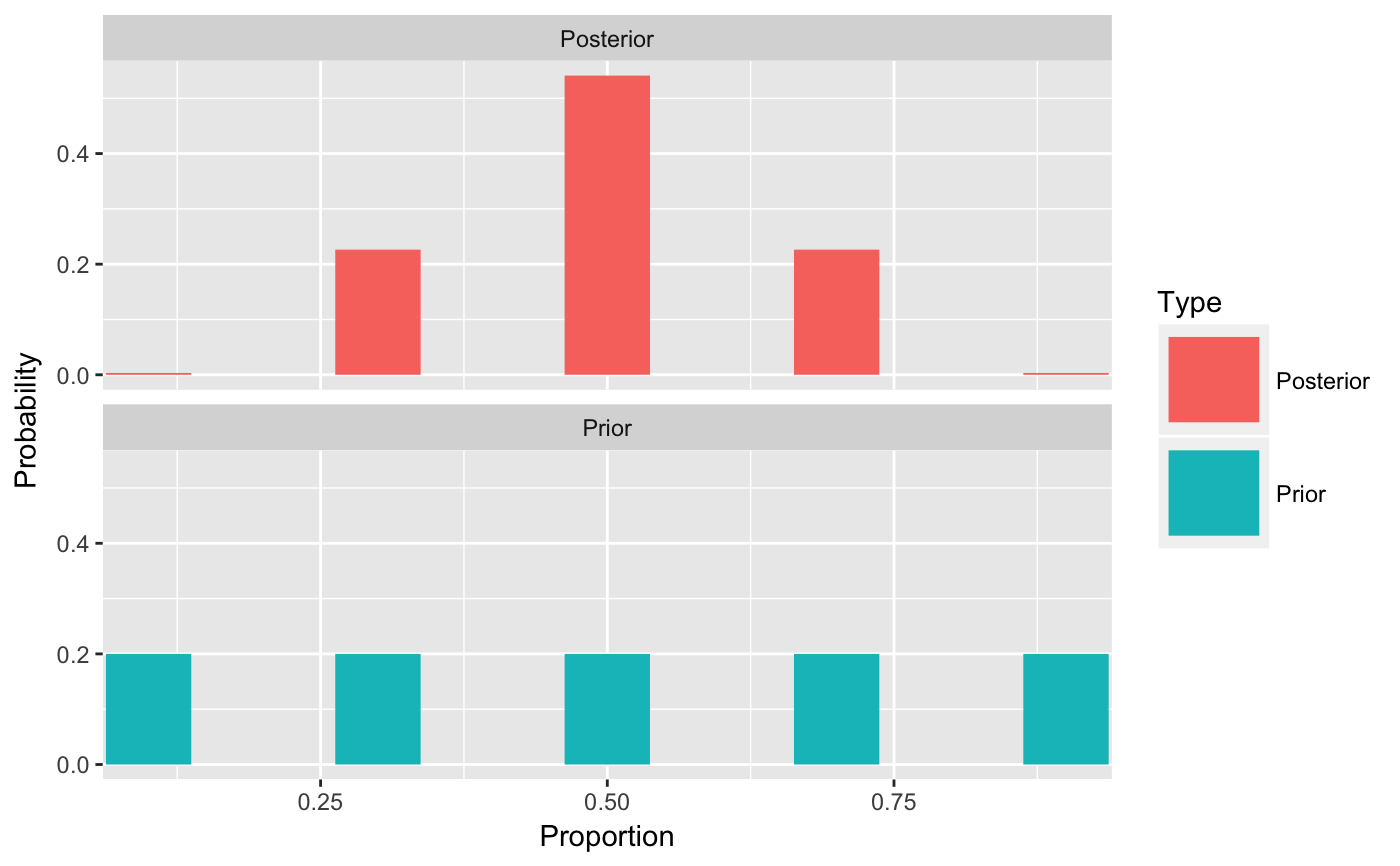
Constructs a comparative plot of the prior and posterior distributions using separate panels.
Examples
df <- data.frame(p=c(.1, .3, .5, .7, .9),
                 Prior=rep(1/5, 5))
y <- 5
n <- 10
df$Likelihood <- dbinom(y, prob=df$p, size=n)
df <- bayesian_crank(df)
prior_post_plot(df, "Proportion")